Drink
One Shipment: −2°C Container Setpoint and Reported −7°C Storage
Scope and measurement note | updated 3 September 2026: This case study reports one shipment from Japan to Bangkok. The −2°C figure is the container setpoint; the logger readings and the reported subsequent −7°C warehouse storage are separate information. They are not operating conditions for every product or shipment. The logger record ends at arrival handling, so it does not verify subsequent warehouse storage or final delivery. Readings describe the sensor’s location, not the temperature inside every bottle, and do not by themselves establish unchanged product quality. Cargo identification, the exact sensor position, calibration and the original logger export must be checked before this account is used as independently verified operational evidence.
20,880 Reported Logger Readings from One Shipment to Bangkok

Let’s start with one number: 20,880.
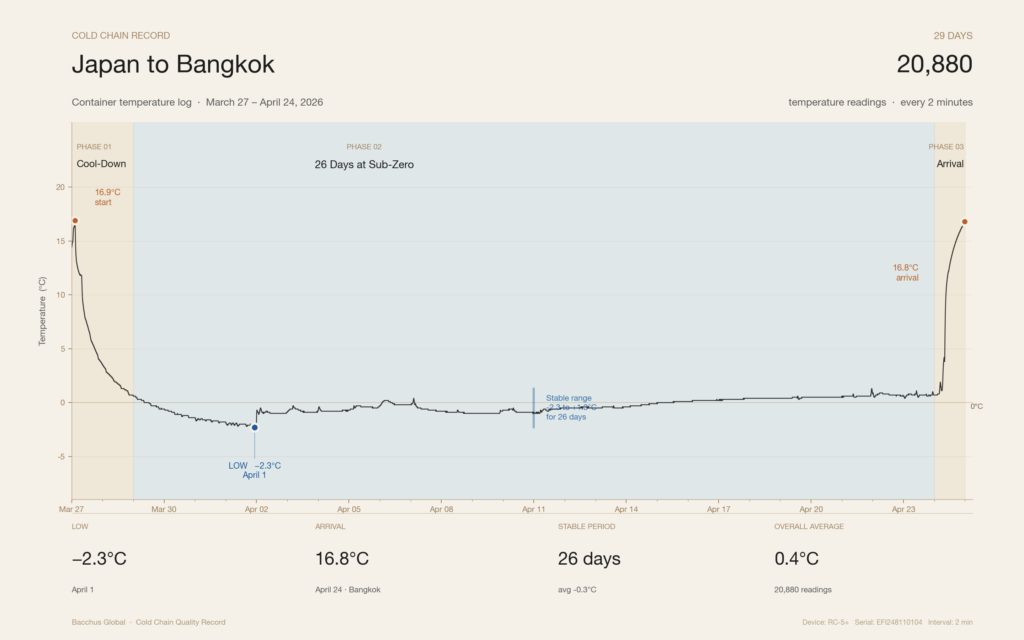
That is the number of temperature readings recorded by a single temperature logger inside one refrigerated shipping container during one shipment from Japan to arrival handling in Bangkok|every two minutes, over roughly 29 days. The logger’s serial number was EFI248110104. The recording period ran from March 27, when cooling of the reefer container began, through April 24, when the doors were opened in Bangkok. The lowest temperature recorded was −2.3°C, the highest was 16.9°C, and the overall average was 0.4°C.
The readings describe conditions at the logger’s position during the reported recording period. They should not be read as continuous measurements of every bottle or of every location within the container.
March 27–28: Cooling Begins
At 2:33 a.m. on March 27, the logger recorded 16.9°C. This marks the starting point of the recorded period. It is likely the moment when the container doors had been closed and the reefer unit had begun cooling.
The temperature dropped sharply from there: 7.3°C by noon that same day, then 3.5°C by nightfall. On March 28, it moved from 3.5°C during the day to 0.6°C by night. On the graph, the line falls at a nearly vertical angle toward the subzero range. In roughly 36 hours, the temperature had plunged by about 16°C.
March 29–April 23: Reported 26-Day Stable Period
For approximately 26 days, from March 29 to April 23, the temperature remained stable within an extremely narrow range: −2.3°C to +1.3°C. The average during this period was −0.3°C. Even when the graph is expanded, the average daily fluctuation is less than 1°C.
The reported container setpoint was −2°C. This is distinct from the logger’s measured range of −2.3°C to +1.3°C and its reported stable-period average of −0.3°C. The lowest reported reading, −2.3°C, occurred at 10:33 p.m. on April 1. The record therefore does not describe 26 days continuously at −2°C or entirely below 0°C.
These measurements can help describe one transport stage. They do not, on their own, establish the condition of the cargo or preservation of its aroma or other characteristics. That assessment requires product-specific handling instructions and evidence beyond the temperature trace.
April 24: Into Bangkok Air, Then Into −7°C
On April 24, the graph begins to rise sharply again. This was the moment the container doors opened and Bangkok air entered. Within the same day, the temperature rose from 0.7°C to 16.8°C. The long journey of the single logger that had kept recording throughout the voyage ends here.
The original account describes a transfer after unloading to warehouse storage at −7°C. This is a reported condition for the subsequent storage stage, not a temperature measured by the shipment logger after its record ended. Separate handover and warehouse records are needed to establish timing, conditions and any exposure during the transfer.
The reported starting reading of 16.9°C and arrival reading of 16.8°C refer to the sensor. Neither establishes the temperature inside the bottles or the duration of exposure for the entire cargo. Warehouse storage remains a separate stage from these readings.
What This Record Can and Cannot Show
The line drawn by those 20,880 points is usually invisible. A temperature logger is not placed beside each bottle that reaches a counter in Bangkok. Customers do not see the graph.
The article reports readings from March 27 to April 24, including a 26-day stable period during transport with a −2°C container setpoint. The subsequent −7°C warehouse condition is reported separately. This account is specific to the shipment described and is not a guarantee of identical conditions for all products or of unchanged quality between Japan and Bangkok.
This article is intended solely to explore the cold chain logistics and temperature management practices in international beverage shipping, and does not aim to promote or encourage the consumption of alcohol. / บทความนี้จัดทำขึ้นเพื่อนำเสนอข้อมูลเกี่ยวกับการขนส่งแบบควบคุมอุณหภูมิ (Cold Chain) และการบริหารจัดการอุณหภูมิในการขนส่งเครื่องดื่มระหว่างประเทศ เท่านั้น มิได้มีเจตนาเพื่อส่งเสริมหรือโฆษณาเครื่องดื่มแอลกอฮอล์ สำหรับผู้มีอายุ 20 ปีขึ้นไป โปรดดื่มอย่างรับผิดชอบ
Discover the culture behind every bottle
We share brewery stories, tasting notes and the craft of koji & fermentation | for educational and cultural purposes only.
เราถ่ายทอดเรื่องราวจากผู้ผลิต บันทึกรสชาติ และศาสตร์แห่งโคจิและการหมัก | เพื่อการศึกษาและวัฒนธรรมเท่านั้น
Follow on Instagram FacebookRelated Articles
“A Japan–Bangkok Shipment: Reviewing the Published Temperature Summary” / “Sake Temperature Management by Product and Logistics Stage” / “Sake Storage in Bangkok: Product-Specific Handling” / “Three Hurdles a Bottle of Whisky Must Clear Before It Reaches Bangkok”